Viewing Equipment in Real Time
Getting Started
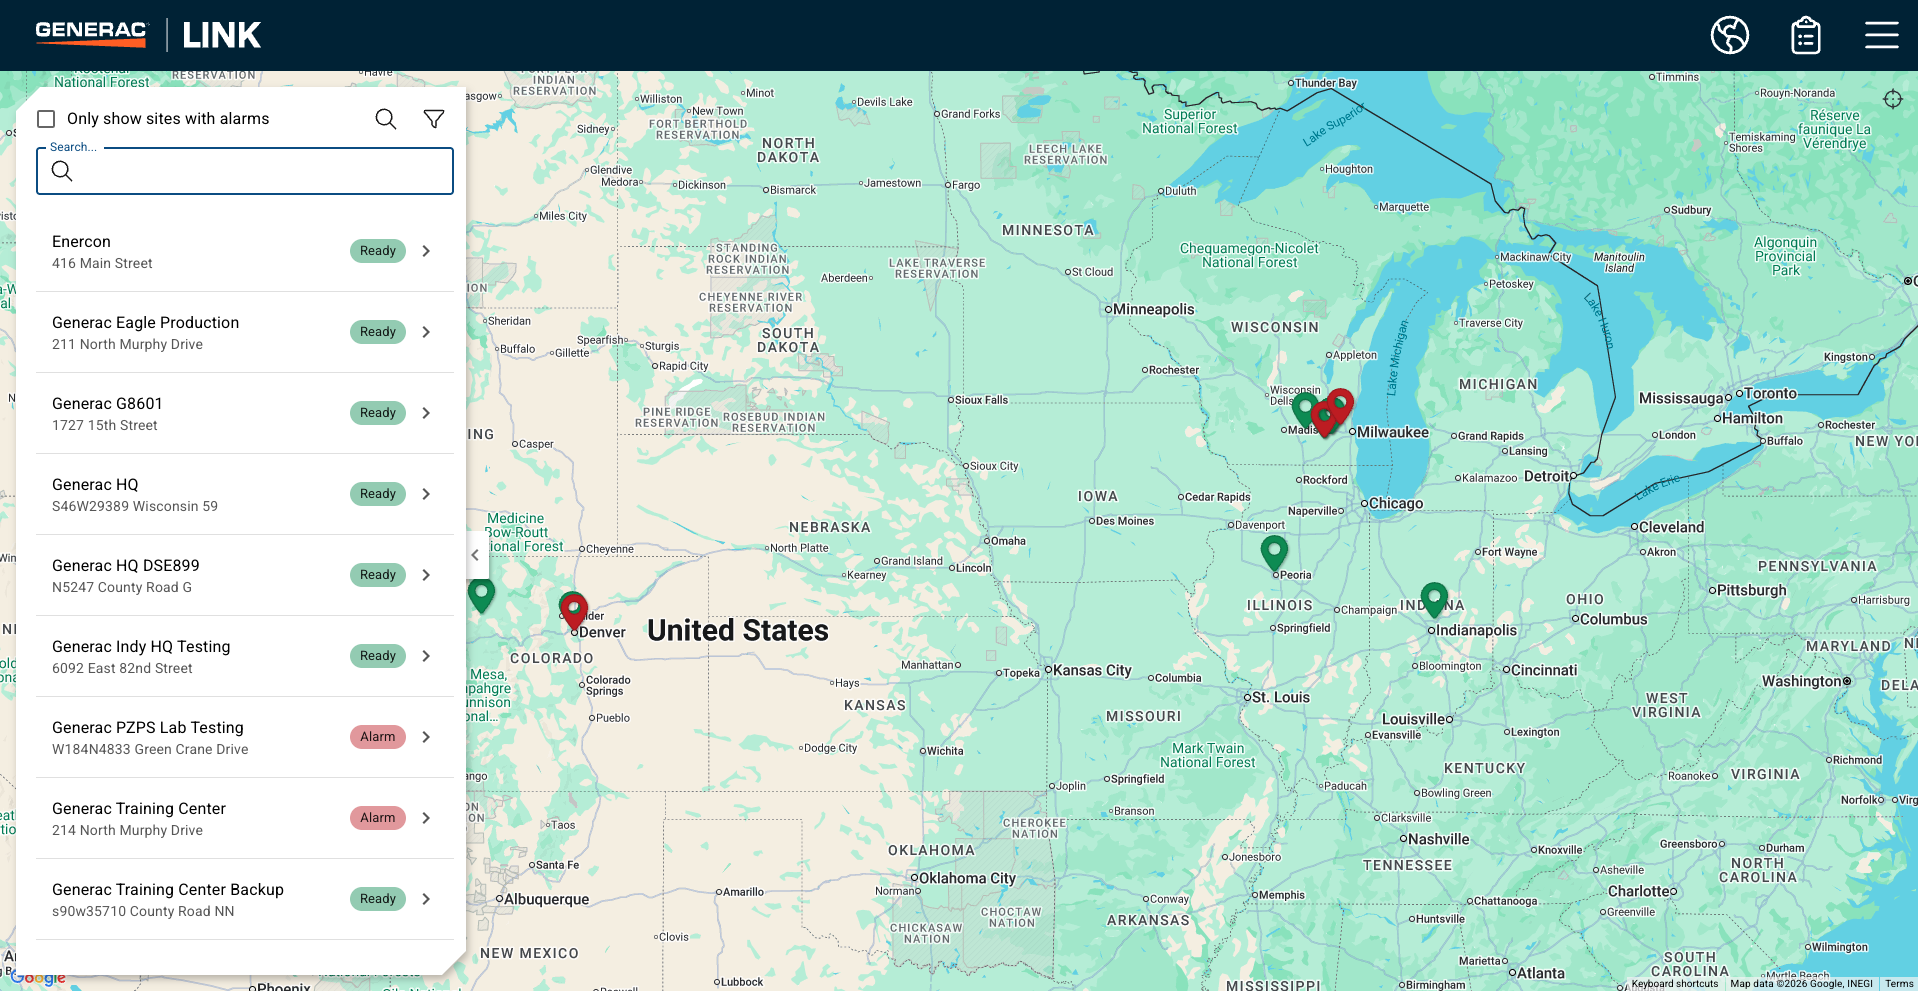
Access a list of equipment by clicking the site pin from the Map View landing page, or click to view sites from the List View (see upper left portion of window). You can always click into the banner to return to this map view.
The application provides a list of equipment for the site along with any active alarms.
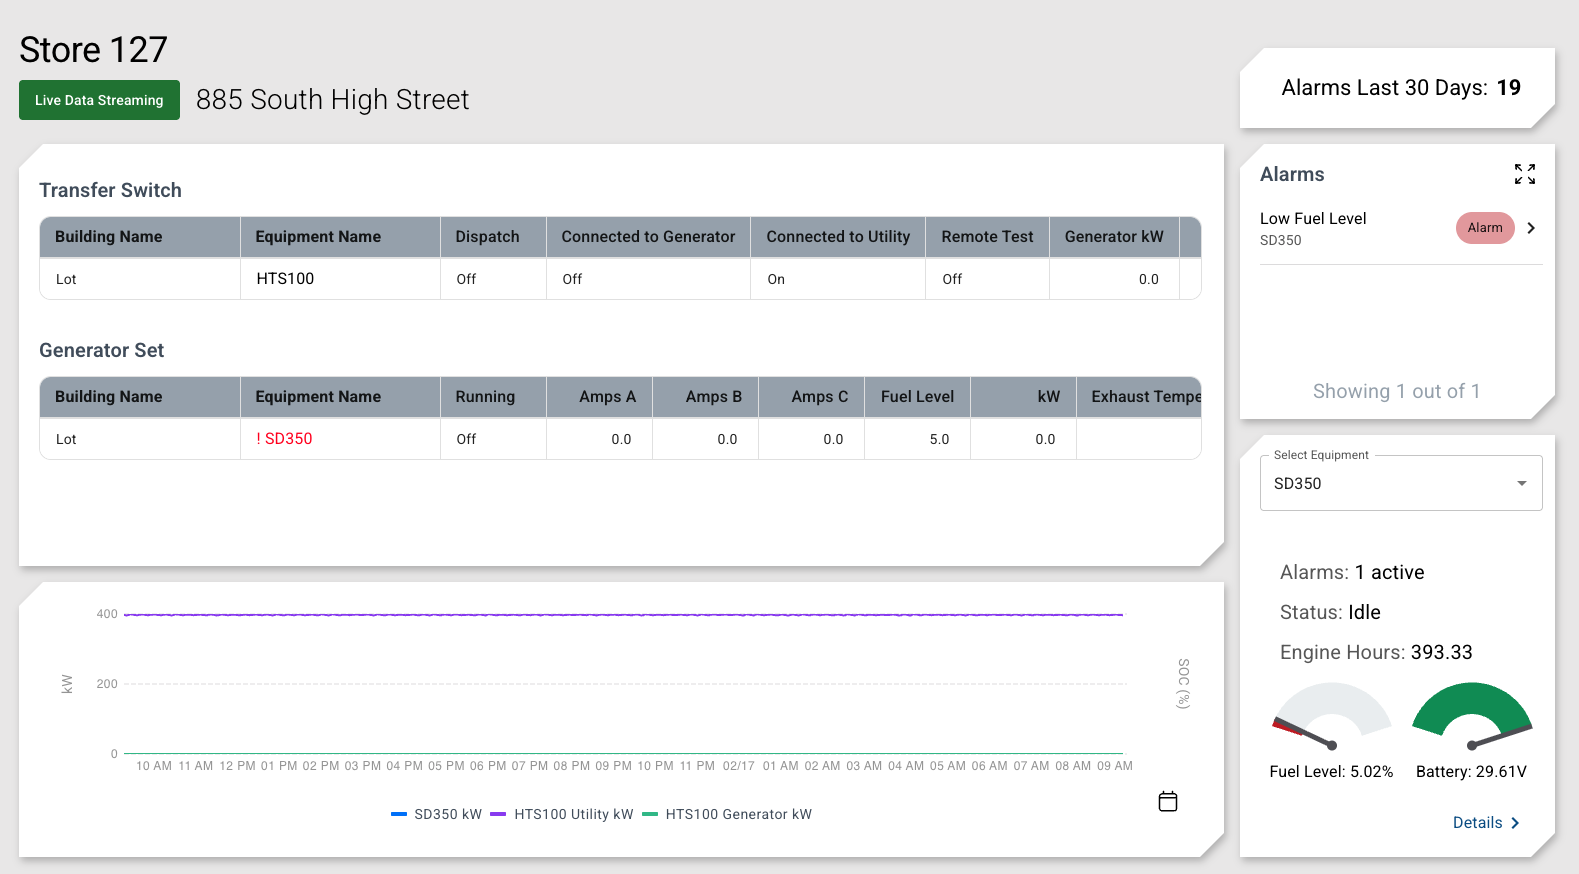
The application displays the most recent data value available. A timestamp is indicated for active alarm activity in the timezone configured for the user. Data will automatically stream for 15 minutes. When the data stops streaming the application displays a message. This can occur when there is an idle session in one of the user’s browser windows.
To manage equipment alarms and generator telemetry, simply click on the equipment from the screen.

This will launch the tab view. From here, the user can scroll through telemetry, reports, and alarms to assist with diagnosis of any anomalies.
Refer to the Equipment and Alarm Configuration topic for information on setup.
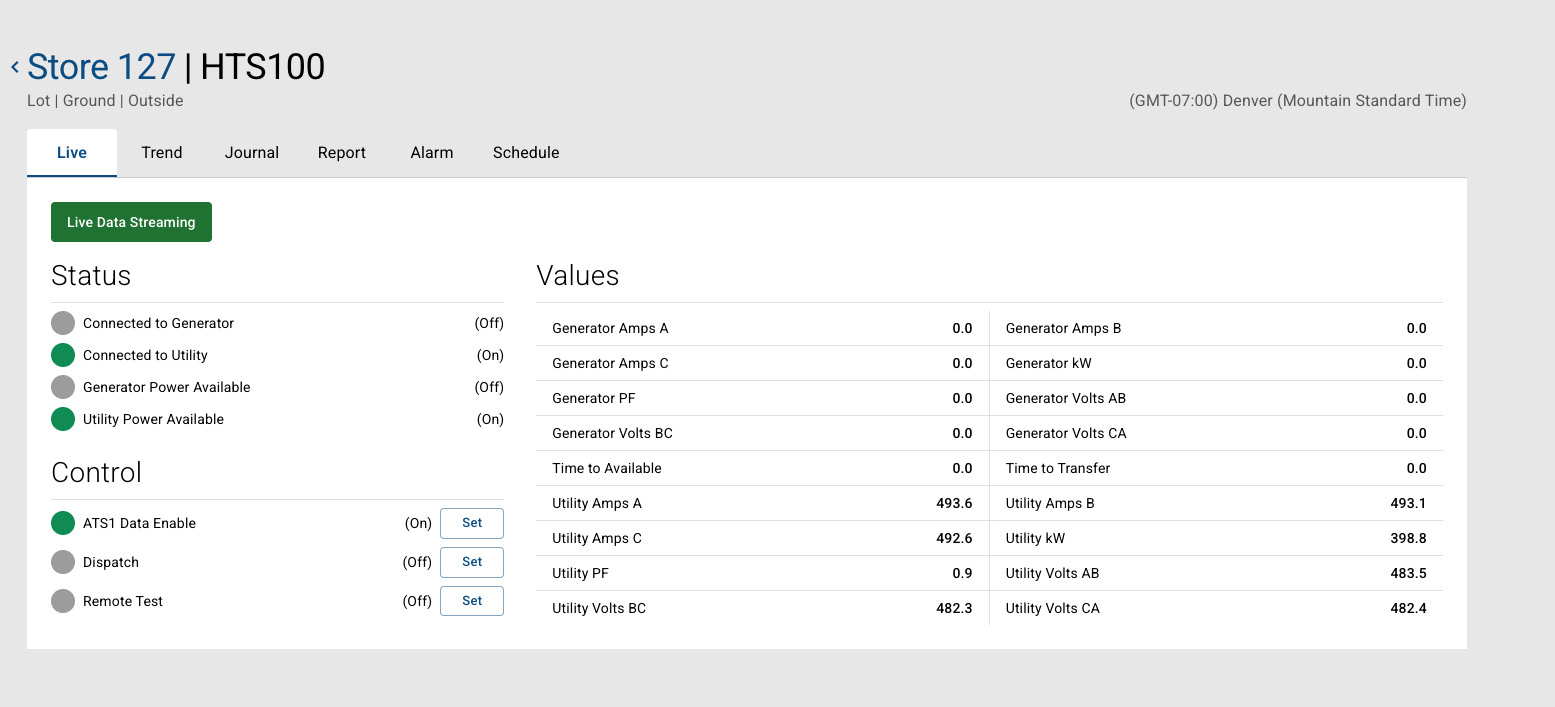
If a stream times out—typically configured to occur at 15 minutes—click Restart Stream. The platform will always render the most recent data value posted. If N/A appears, this indicates there is no data or an interruption in gateway communications.
Using Trend Data for Diagnostics
From the Trend tab, many fields are selectable, such as energy (kW), coolant temperature, engine hours and so on. The platform offers the ability to drill down to specific values to best monitor site equipment.
To obtain an equipment trend:
Choose Value to display in a time series.
Select a preset date range or choose Custom.
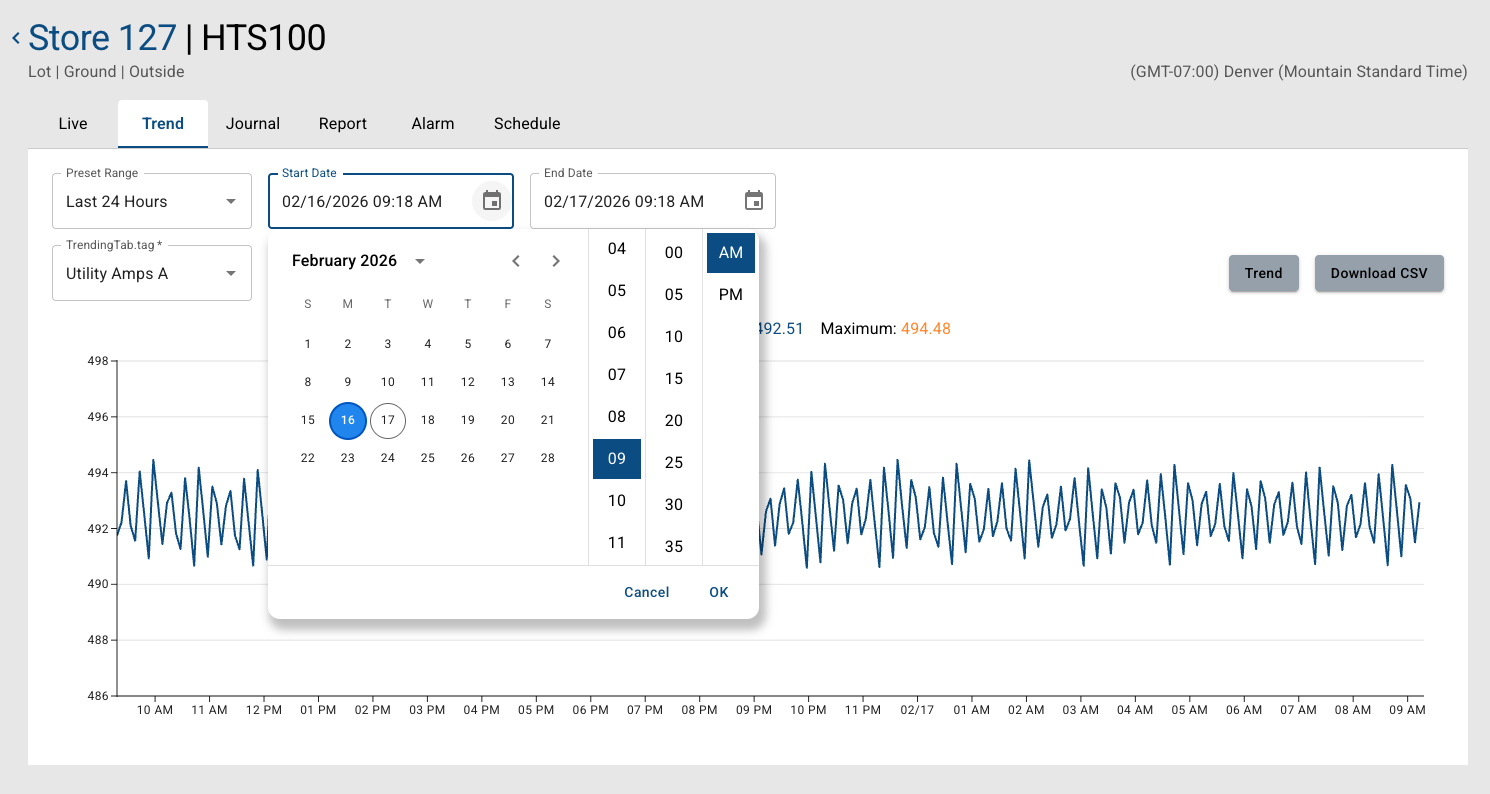
Click the Trend button. If you chose Custom, use the date/time modals to enter a date range selection. This can help the user focus on any anomalous values for the parameter chosen.
Use the calendar and clock modals to select a custom date and time range, for example, if the user needs to examine a particular month.
After the date/time modals have a Start and End value, click the Retrieve button.
The user is able to download the data to a CSV file if further reporting or troubleshooting is required. However in this capture of telemetry, the coolant temperature indicates generator run activity.
A user could drill down to look at any equipment parameter configured for the site. In this case we’re capturing a period of raised coolant temperatures to check for any evidence of equipment issues.
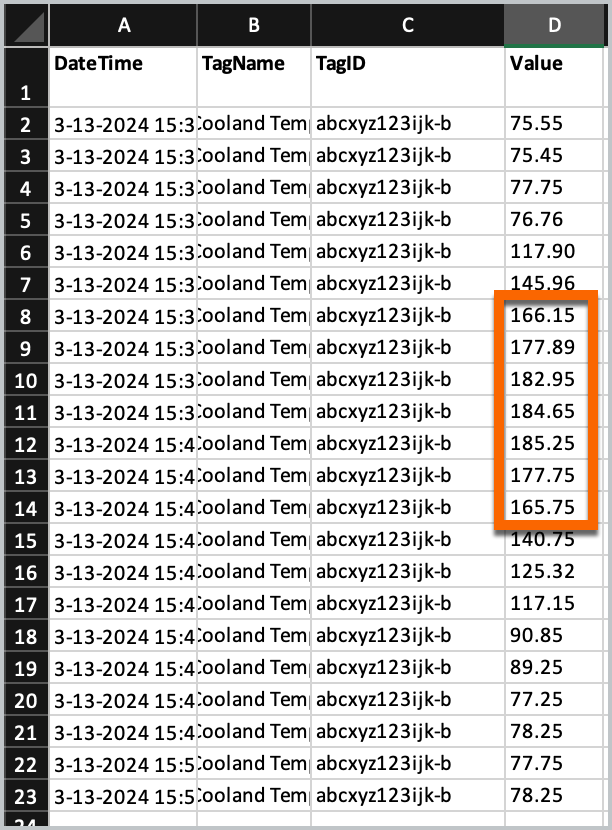
Download Data to Spreadsheet
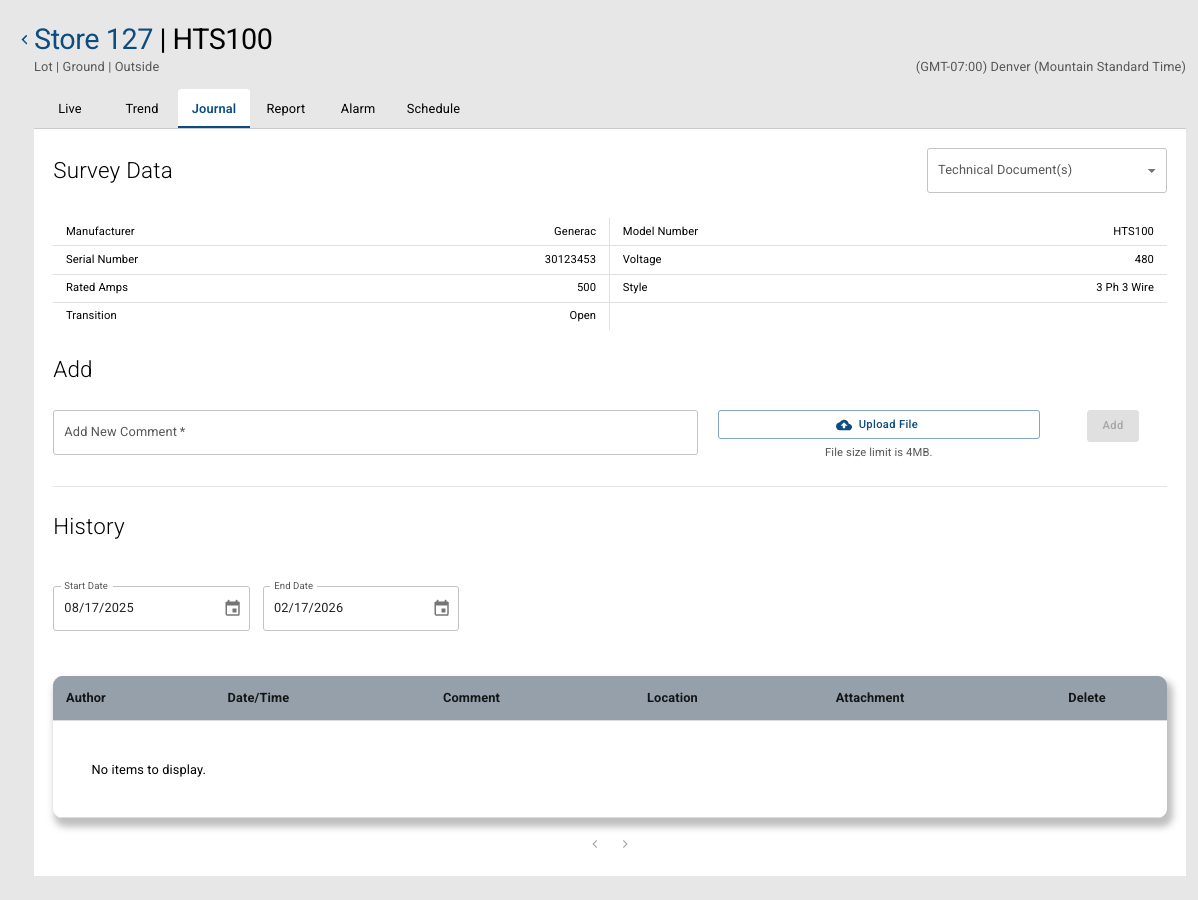
If necessary, such observations could be included in log entries. Please refer to the Equipment Journal article for details on maintenance histories.
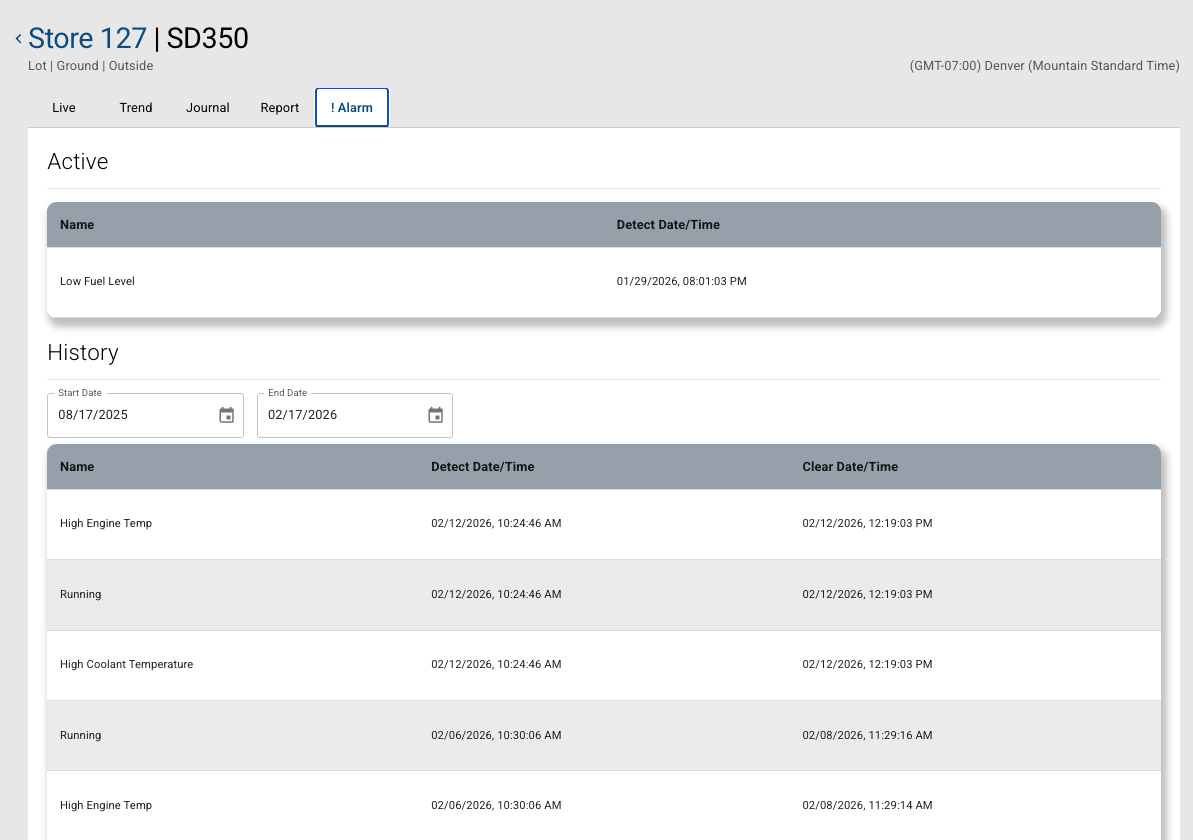
An Alarm tab will display both active alarms and an alarm log history. Alarms for coolant temperatures would appear in this log if configured accordingly.
