
Data Trending
From the Trend tab on any equipment page, you can select up to 5 analog data points to review historical data across a window of up to 31 days. You can also create Saved Views — preset combinations of data points and a time range — so your most-used data is just a click away. Any data you pull up can also be exported to CSV for use in custom reports.
Data Points Selector
Single Equipment Selections
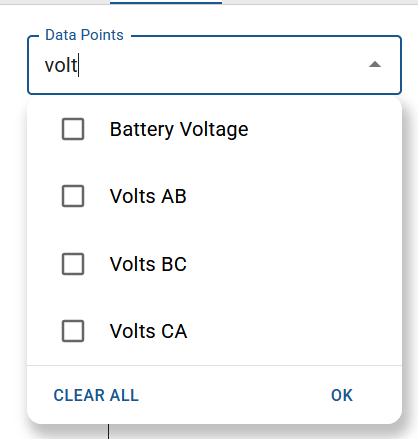
The Data Points dropdown can be used to select up to 5 values. When expanded the field can be used to search by name. Click OK when selections are complete.
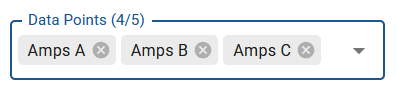
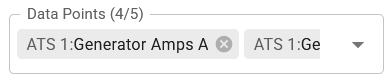
When collapsed, current selections are shown with an 'X' to quickly remove individual items. The full list can be viewed by scrolling left/right with two fingers.
In drop-downs with many options, current selections are sorted to the top for easy review and adjustment.
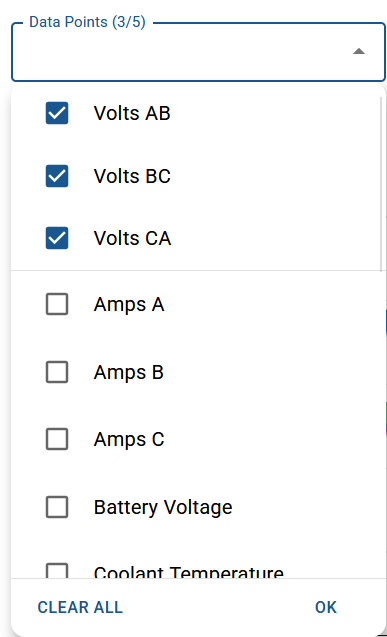
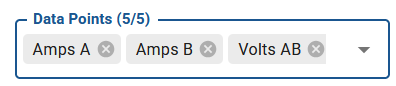
The current selection count is displayed in the drop-down border. The label will bold to indicate the maximum is reached.
Multi Equipment Selections (Site Summary Page)
Selector has search field for finding data points by name across all equipment.
Browse data points by selecting an equipment name from the left panel to view its available tags on the right, or scroll through the full list directly.
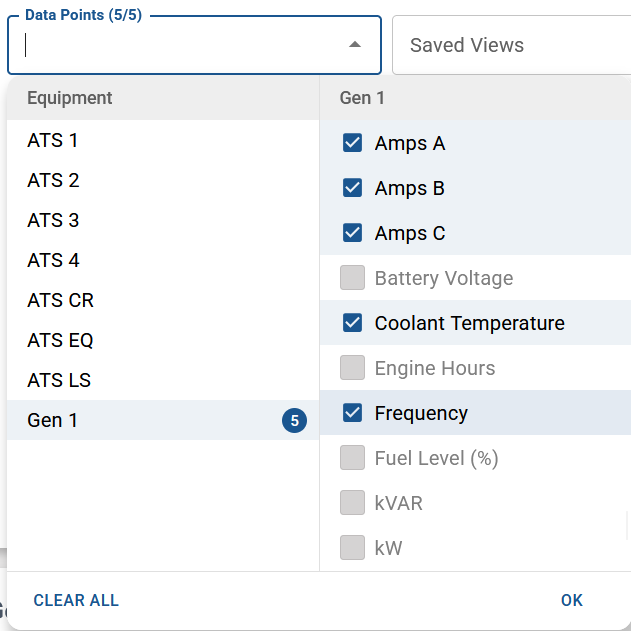
As tags are selected, a numbered badge appears next to each equipment name indicating how many tags are selected for that equipment.
The total number of current selections is shown in the selector field.
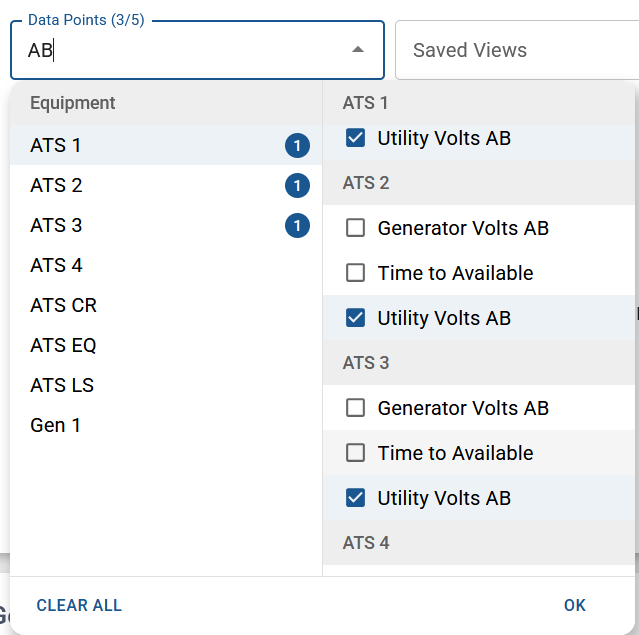
Once the maximum of 5 analog values is reached, the selector field border is highlighted and the remaining unselected options are grayed out to indicate the limit has been reached. Remove an existing selection to make a different one.
When collapsed the current selections can be viewed or removed identically to the single equipment selector (see notes above).
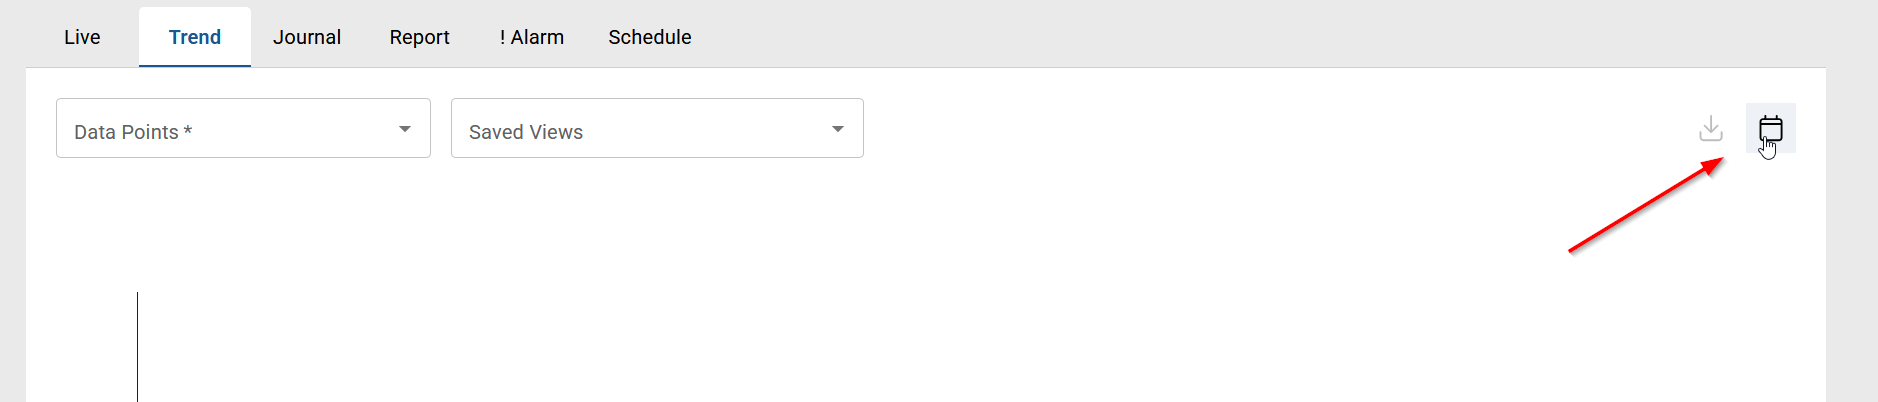
Date/Time Input
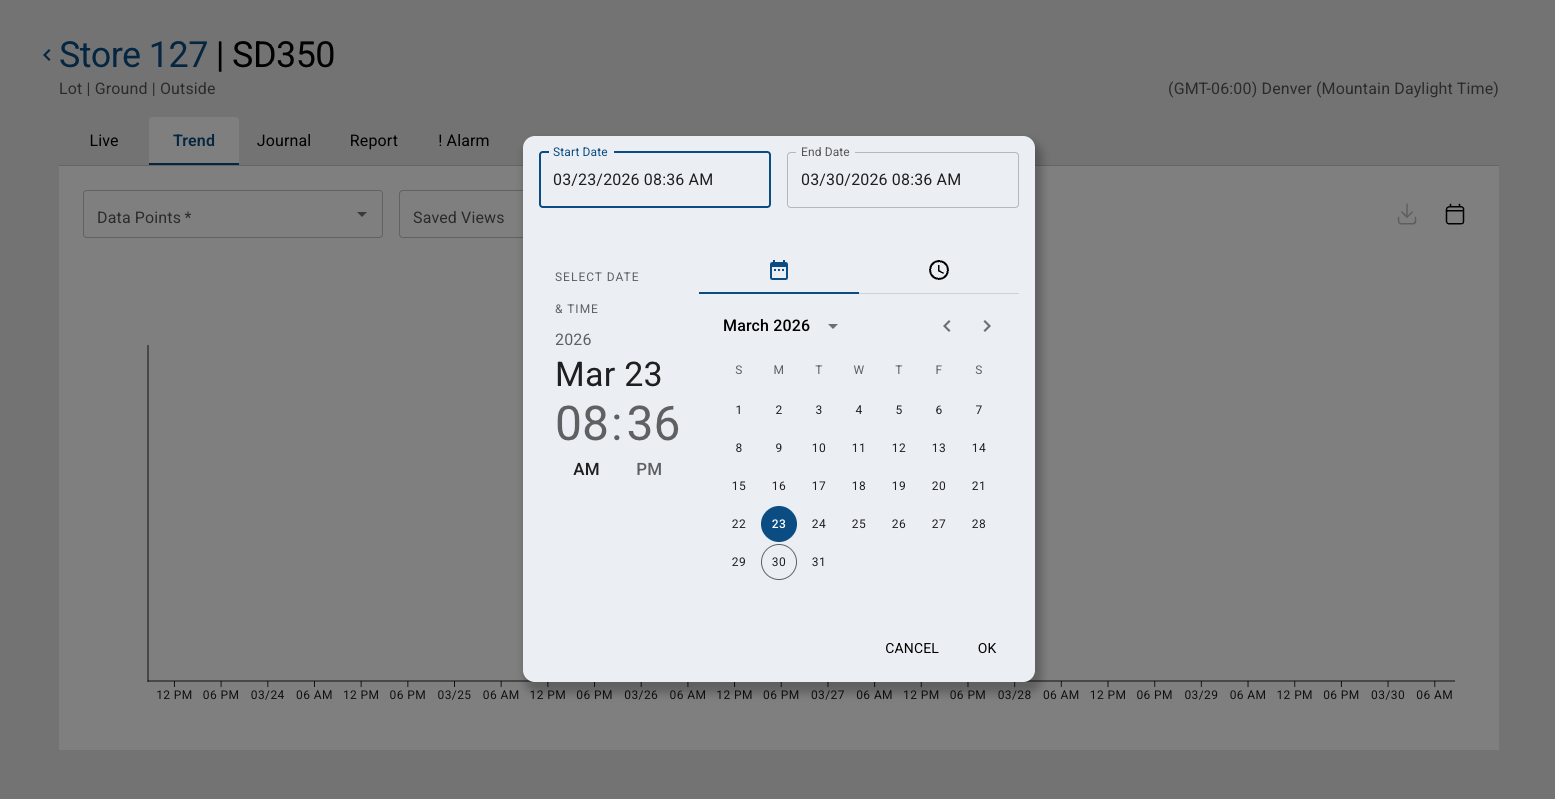
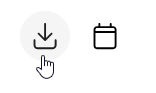
The trending time range is set by clicking the calendar icon in the top-right corner of the trend area. You can type in start and end dates directly to the fields, or use the calendar and clock icons to pick dates and times. Click OK to apply.
Trend Chart
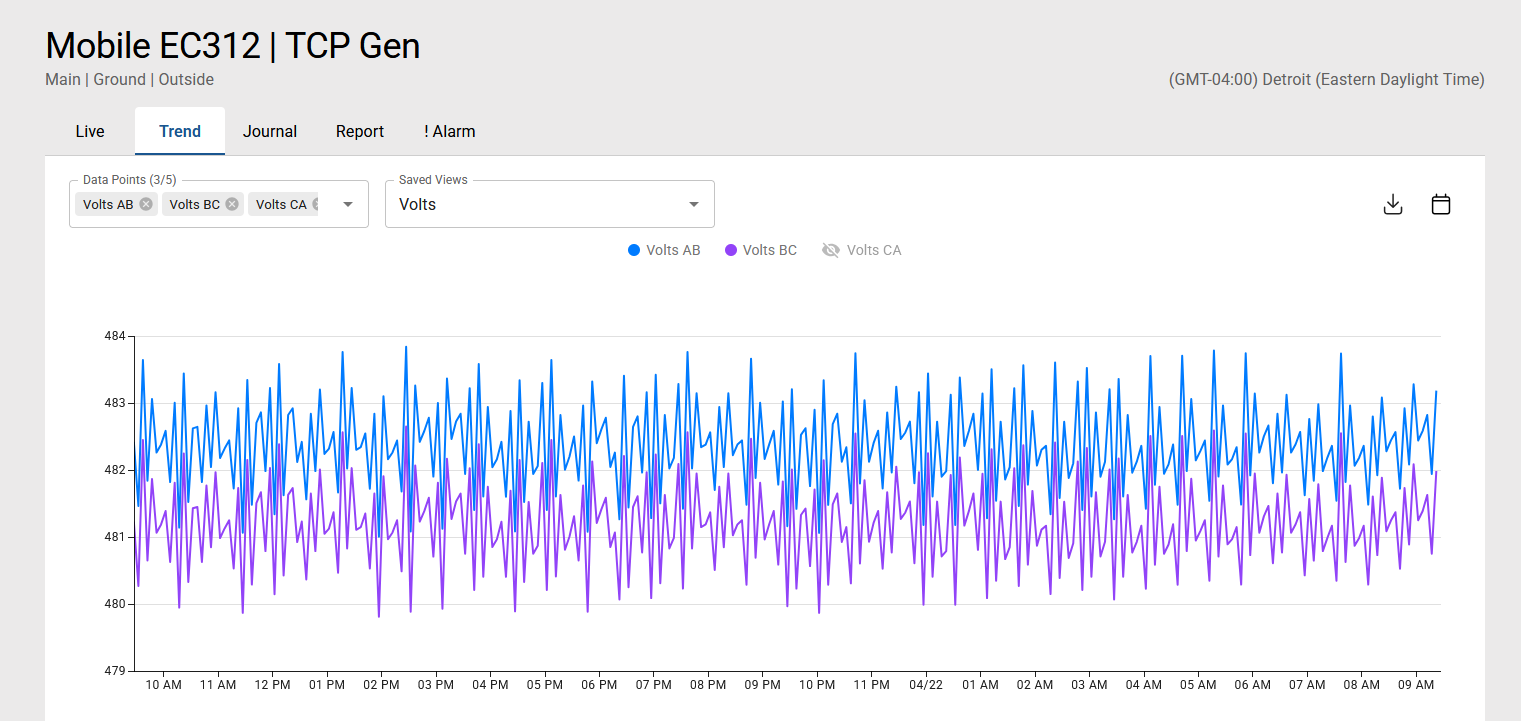
Once your data points and time range are set, the trend chart will populate with the available data.
Click the legend icons to show or hide individual trend lines — a visual indicator will appear on any hidden trend so you always know what's visible.
If data is missing from the specified time window, the trend chart displays labels to help identify the cause of the gap:
Gateway Offline — displayed when no data was recorded due to a lost connection to the Generac Link IoT gateway.
Equipment Offline — displayed when the gateway was online but the telemetry link to the equipment was lost. This is equivalent to the -99 value displayed elsewhere in the app.
The trend chart supports common gestures for navigation: scroll wheel or trackpad pinch to zoom in/out; click+drag or two-finger scroll left/right to pan within the selected time range.
Trend Statistics
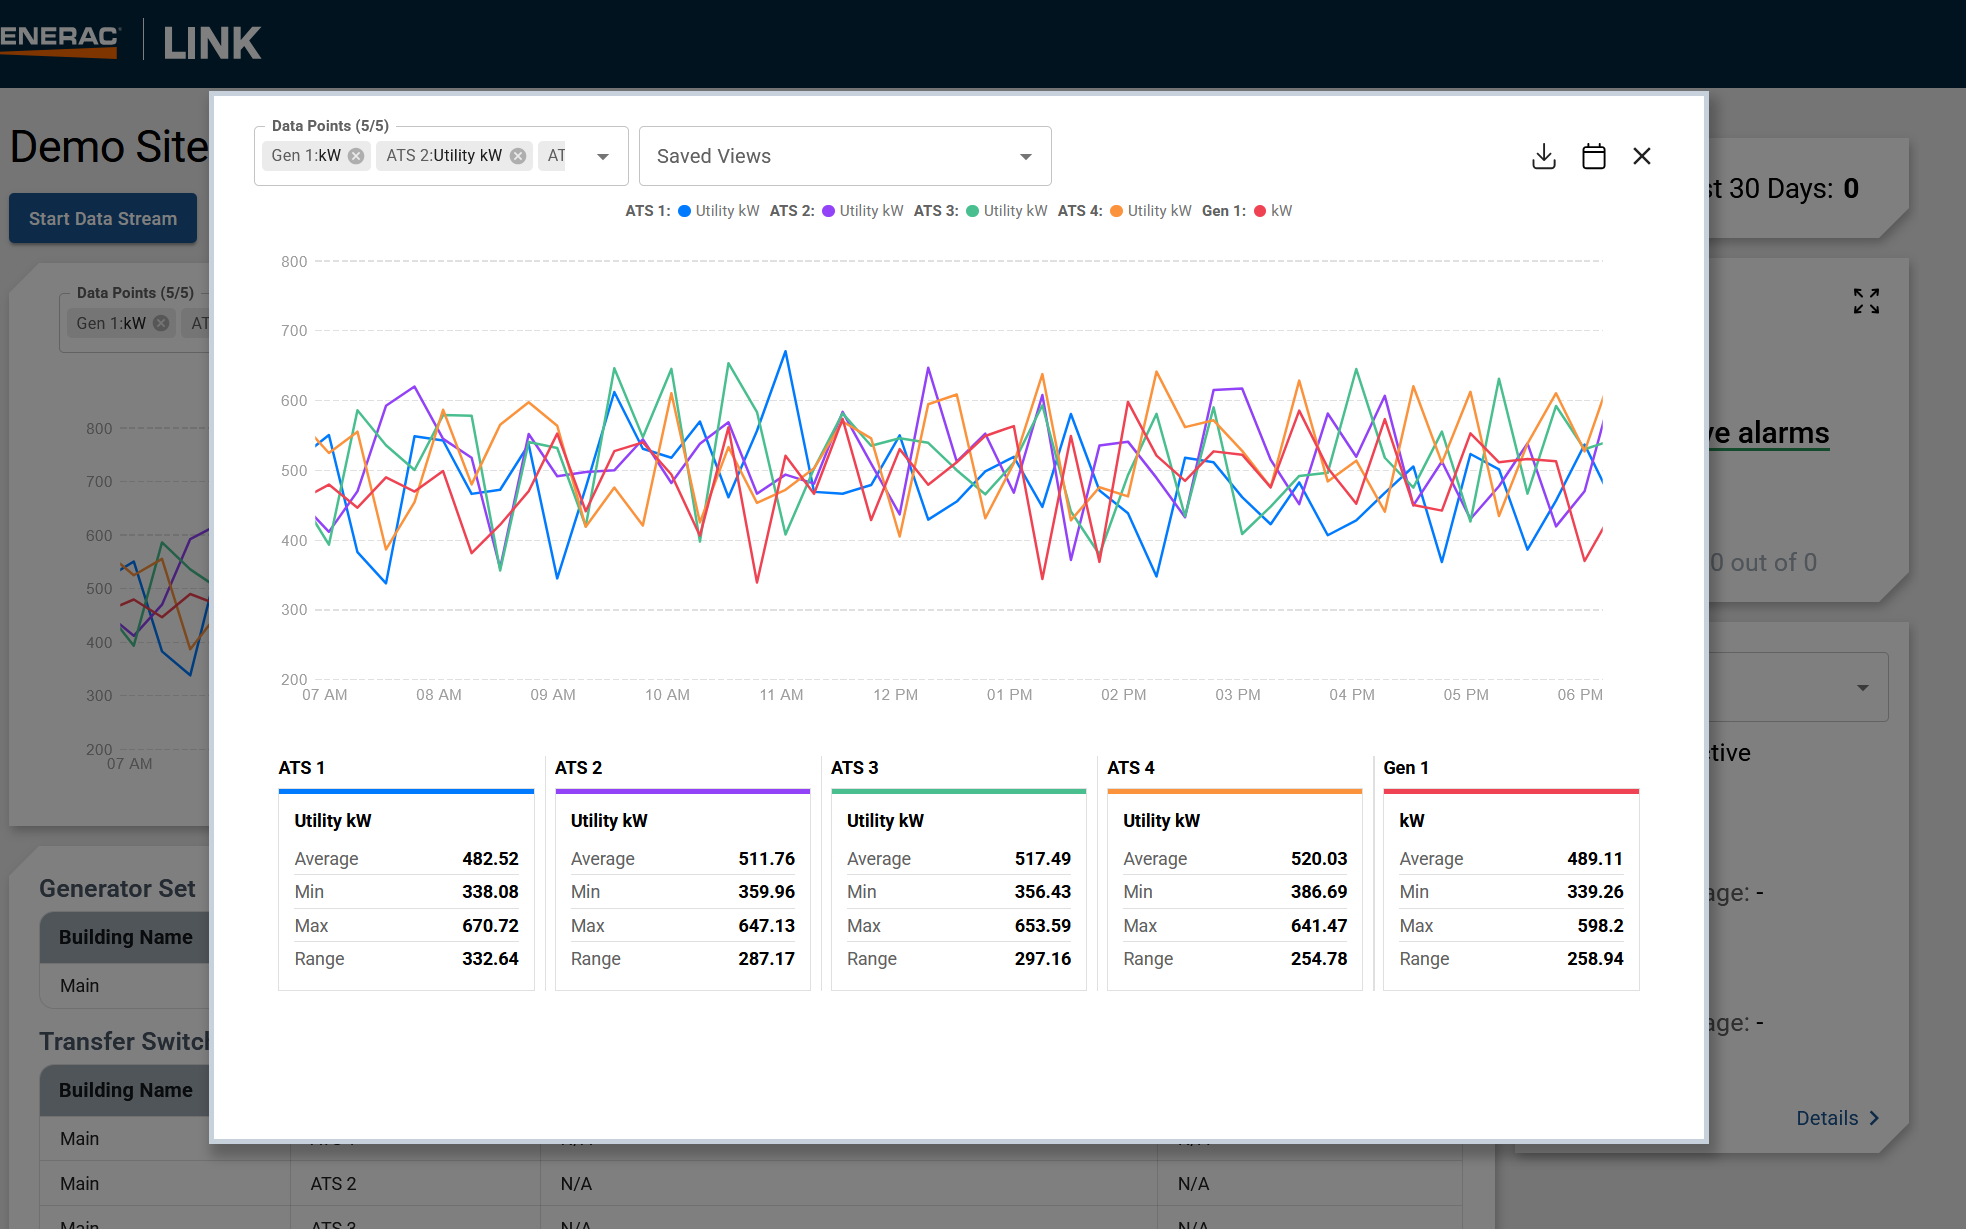
Below the chart, a statistics summary will show the minimum, maximum, average, and range (max minus min) for the selected period.
As you zoom and pan the trend chart, the statistics summary will update to reflect the visible time frame.
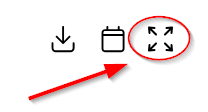
From the Site Summary page, statistics section can be viewed by using the expand icon in the top right corner.
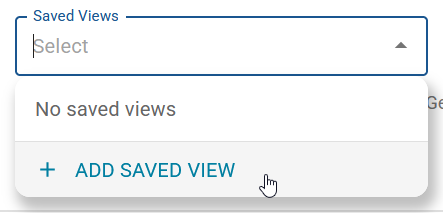
Saved Views
To create a Saved View, open the Saved Views dropdown and click + ADD SAVED VIEW.
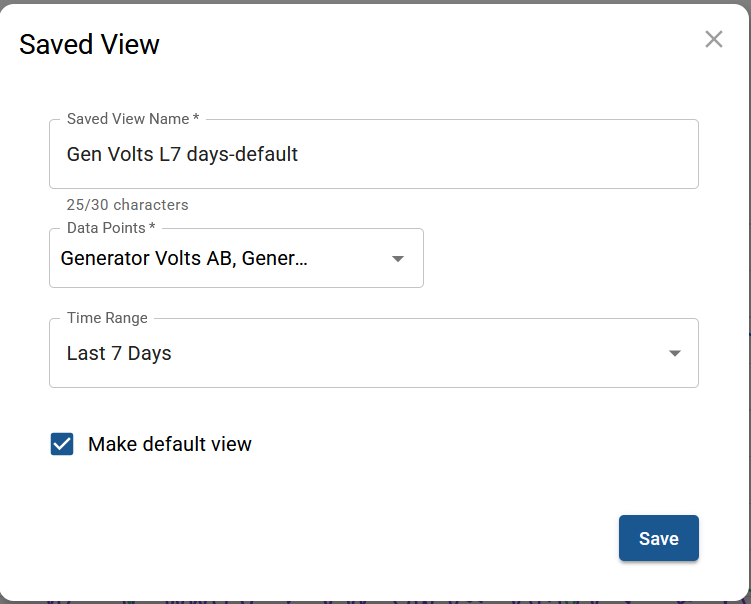
Give your view a name, then choose the data points and time range you want to save. Check Make default view if you'd like this view to load automatically every time you open the Trend tab.
Trend Data Download
To export the data, click the download icon to save as a CSV file.
The data download will also reflect the visible time frame as you zoom and pan, so what you export matches exactly what's on screen.